ETF Trading Strategy Overview
For those who desire above average return strategies and are comfortable trading their own accounts, ECAM offers the same investment strategies utilized by ECAM in their own brokerage accounts (as well as the Interactive Brokers linked trading accounts) by way of a monthly subscription service.
These trading strategies have historically offered consistent above-average risk-adjusted returns in 4 styles to cater to various individual risk profiles:
Lower Risk/Lower Return
- Basic Low Volatility Bond Trading Strategy (100% bond & 0% equity/REIT/inverse volatility exposure)
- Enhanced Low Volatility Bond Trading Strategy (90% bond & 10% equity/long bond/ inverse volatility exposure)
Medium Risk/Medium Return
- Basic All-Weather Portfolio Strategy (60% equity, 40% bond/REIT & 0% inverse volatility exposure)
- Enhanced All-Weather Portfolio Strategy (40% equity, 30% bond/REIT & 30% long bond/inverse volatility exposure)
Higher Risk/Higher Return
- Basic Multi-Asset Trading Strategy (100% equity or bond & 0% inverse volatility exposure)
- Enhanced Multi-Asset Trading Strategy (60% equity or bond exposure & 40% long bond/ inverse volatility exposure)
Highest Risk/Highest Return
- Maximum Return Trading Strategy (100% equity/long bond/ inverse volatility exposure)
The strategies are actively managed ECAM proprietary trading strategies updated once monthly as market conditions change. All are designed to allow for maximum return based upon varied risk tolerance levels to allow subscribers an opportunity to select the style/strategy best suited to meet their individual requirements. All strategies utilize ETFs traded on US exchanges and no leverage/gearing is utilized. All 5 strategies are included in each subscription.
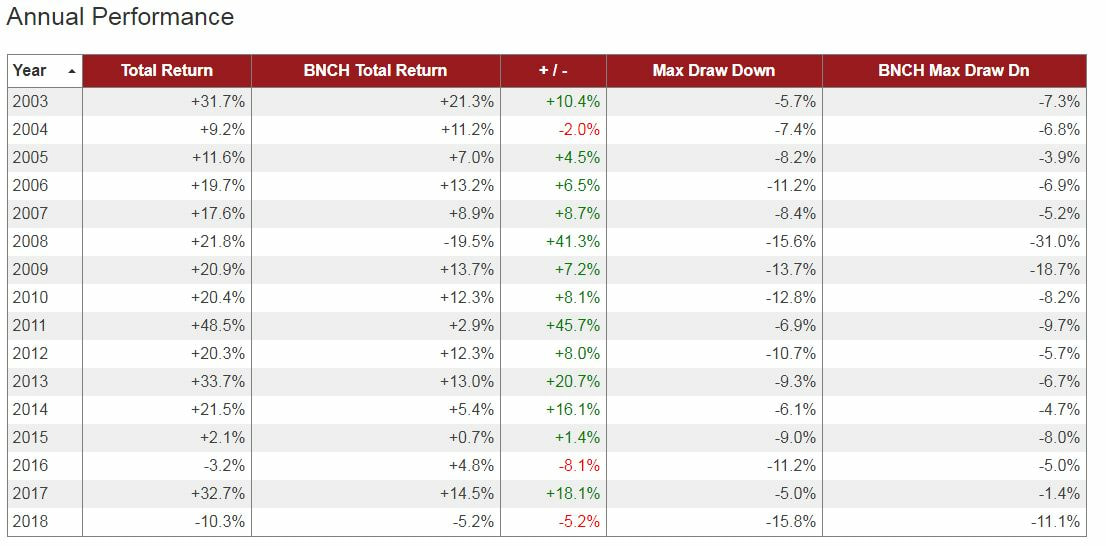
Below are the performance characteristics for the various strategies. Performance of ECAM strategies is indicated in GREEN on the charts vs. the chosen benchmark in BLUE and does not include fees/commissions, slippage or taxes. Past performance is no guarantee of future returns.
Multi-Asset Trading Strategy
The Multi-Asset Class Trading Strategy is our broadest and most popular trading strategy. The strategy has 2 forms; a Basic strategy and an Enhanced strategy. It is designed to match the volatility of the S&P 500 (the chosen benchmark) with greatly increased returns.
- The Basic strategy is composed of a 23 ETF universe with exposure to all world equity regions, U.S. and non-U.S. Government and Corporate bonds, commodities, selected specific sectors (such as biotech and solar power) & precious metals.
- The Enhanced strategy is as per the Basic Strategy but it also includes exposure to medium term inverse volatility and long duration U.S. Treasury bonds.
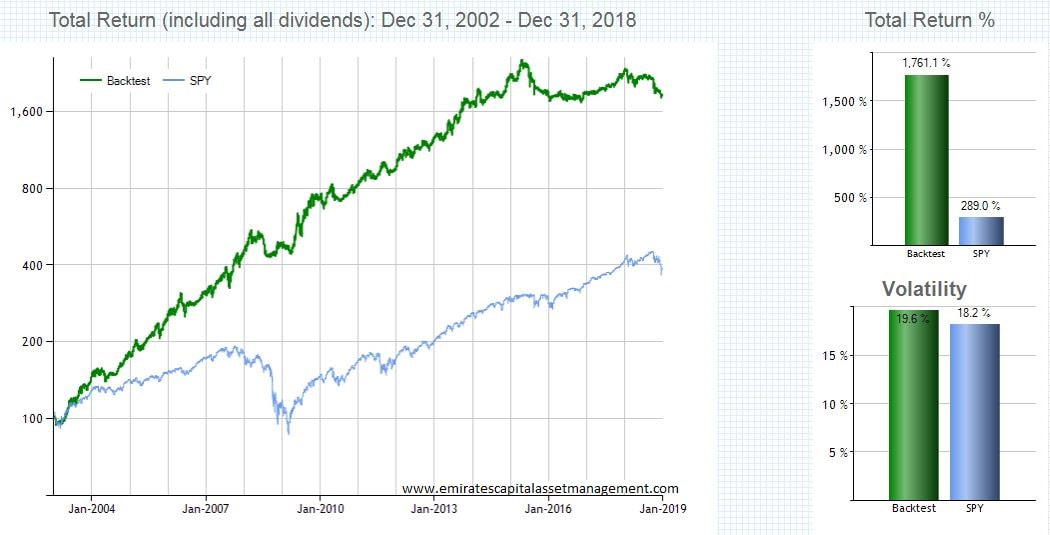
Multi-Asset Trading Strategy 2003-2018 (Basic)
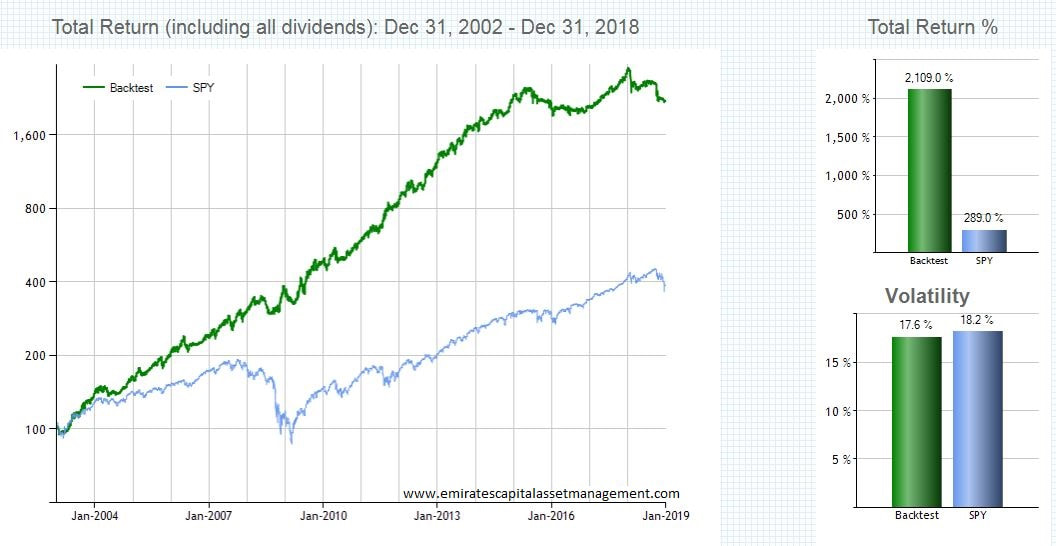
Multi-Asset Trading Strategy 2003-2018 (Enhanced)
As can be seen in the bar chart to the right on the above graphs, for the period Jan 2003-Dec 2018 the ECAM Multi Asset Trading Strategy delivered a gross cumulative total return (all returns quoted include dividends but do not include brokerage fees/commissions, slippage and taxes) of 1761% (Basic strategy) and 2109% (Enhanced Strategy). This compares with a return of 289% cumulative total return for the benchmark (SPY; the S&P 500 ETF) over the same period.
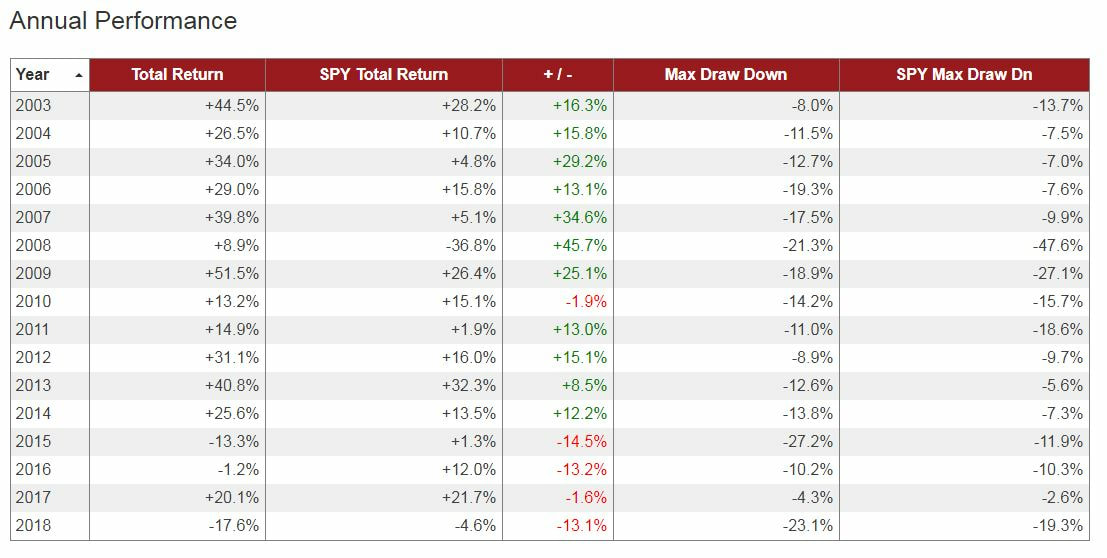
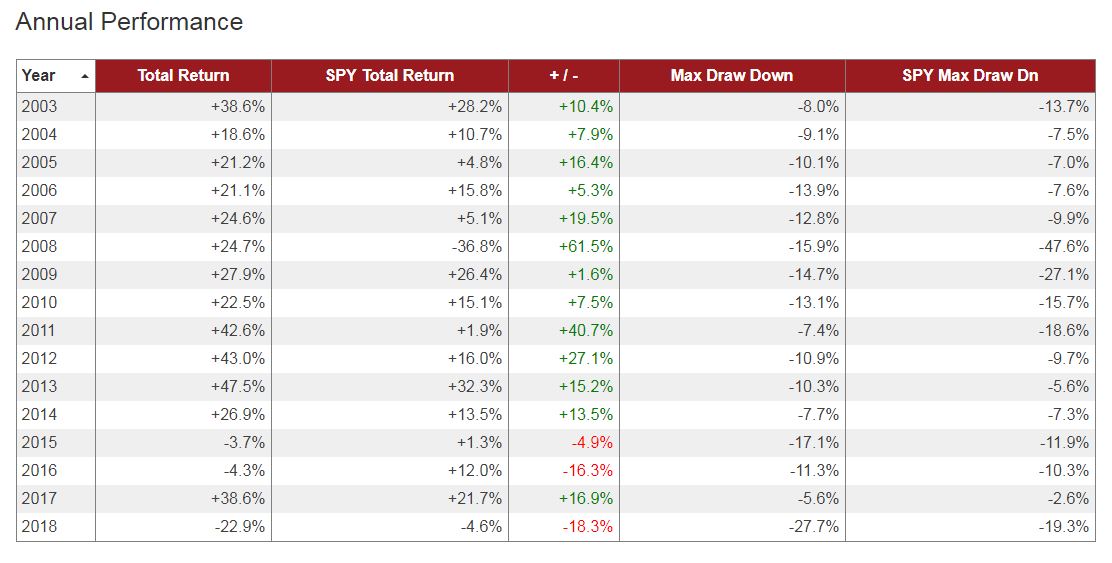
Below is the statistical analysis of the strategy based upon the period 2003-2018.
- CAGR: Compound Annual Growth Rate. Assumes 252 trading days per year.
- Sharpe Ratio: Measures reward per unit of risk. It is calculated as the annualized Avg Excess Return / Std Deviation of Excess Return. Excess Returns are calculated using the cash ETF specified (SHY default). A negative Sharpe Ratio indicates that the mean return of the strategy was less than the mean cash return.
- Max Drawdown: Greatest percentage drop from the high (based on daily closing prices). Drawdown figures should be viewed on a relative basis as rough estimates of comparative risk. In no way does drawdown represent the absolute total risk of a given ETF strategy.
Multi-Asset Trading Strategy 2003-2018 (Basic)
Multi-Asset Trading Strategy 2003-2018 (Enhanced)
Low Volatility Bond Trading Strategies
The Low Volatility Bond Trading Strategy is designed for those who desire returns greater than a typical aggregate bond ETF with similar or lower levels of volatility. The strategy has 2 forms; a Basic strategy and an Enhanced strategy. It is designed to match the volatility of the iShares Core U.S. Aggregate Bond ETF (the chosen benchmark) with greatly increased returns.
- The Basic strategy is composed of a 5 ETF universe with exposure to low volatility U.S. bond ETFs.
- The Enhanced strategy is as per the Basic Strategy but it also includes up to a 10% exposure to medium term inverse volatility, long duration U.S. Treasury bonds and U.S. mid-cap equities..
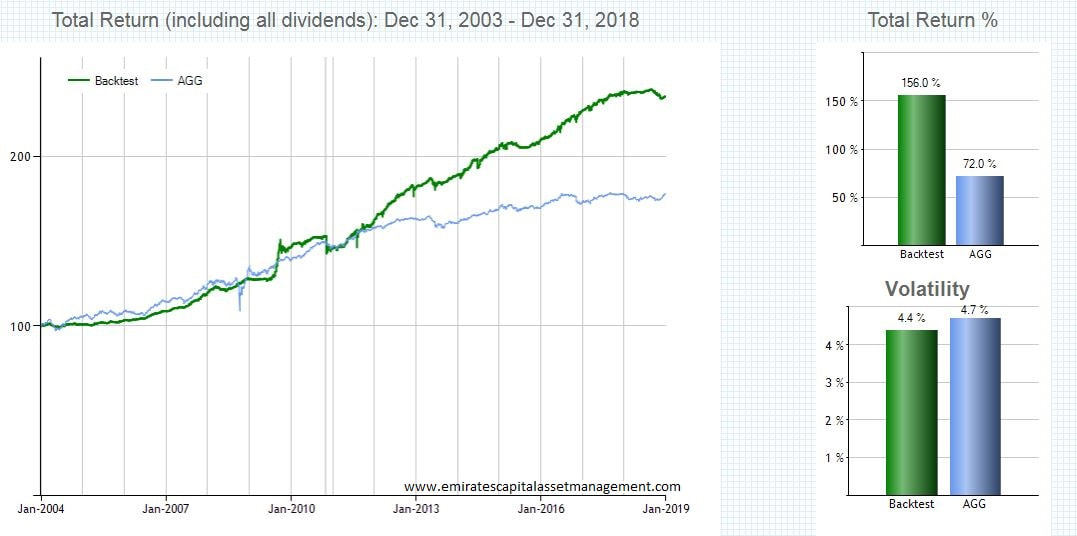
Low Volatility Bond Strategy (Basic) 2003-2018
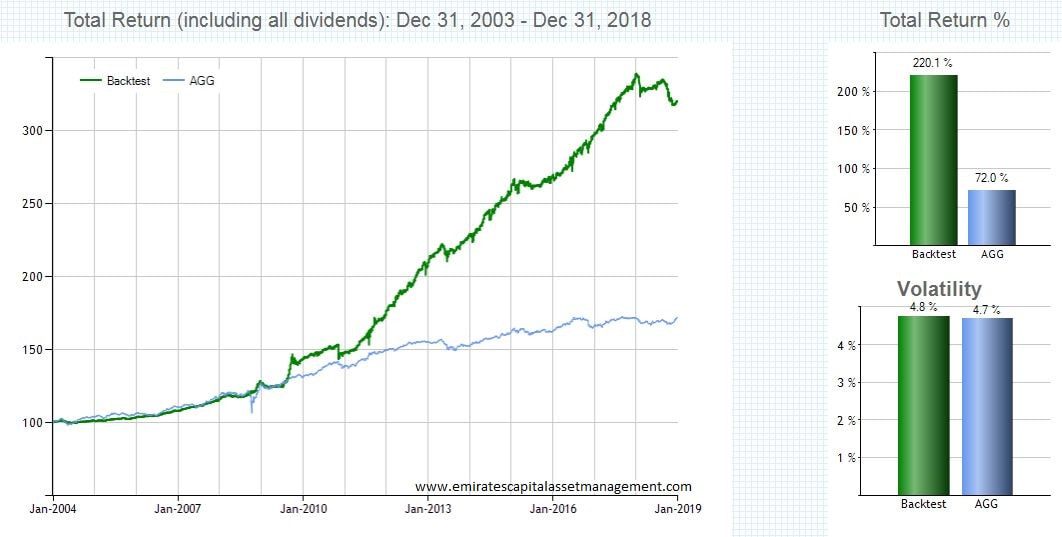
Low Volatility Bond Strategy (Enhanced) 2003-2018
As can be seen in the bar chart to the right on the above graphs, for the period Jan 2003-Dec 2018 the ECAM Low Volatility Bond Trading Strategy delivered a gross cumulative total return (all returns quoted include dividends but do not include brokerage fees/commissions, slippage and taxes) of 156% (Basic strategy) and 220% (Enhanced Strategy). This compares with a return of 72% cumulative total return for the benchmark (AGG; the iShares Core U.S. Aggregate Bond ETF) with the same or lower volatility.
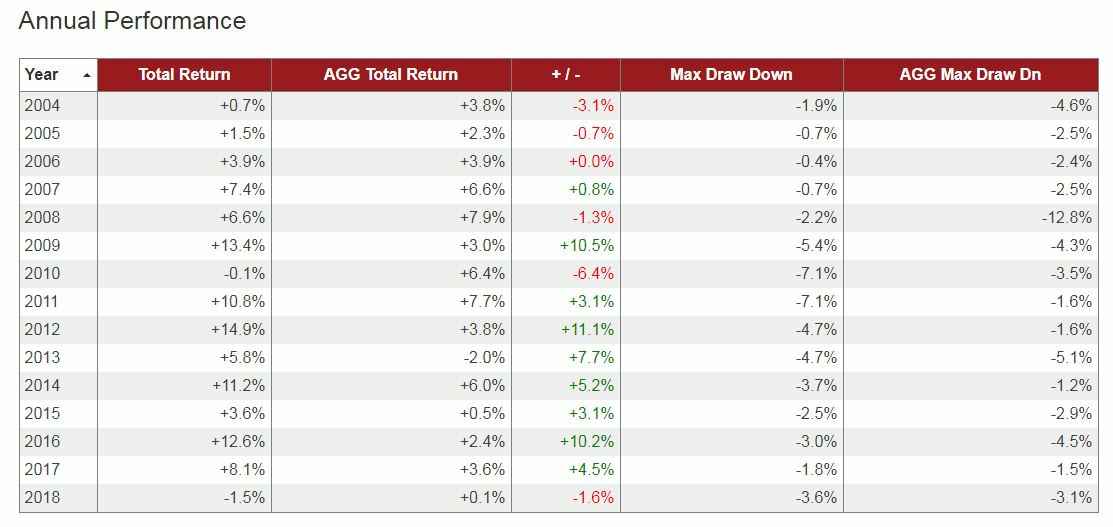
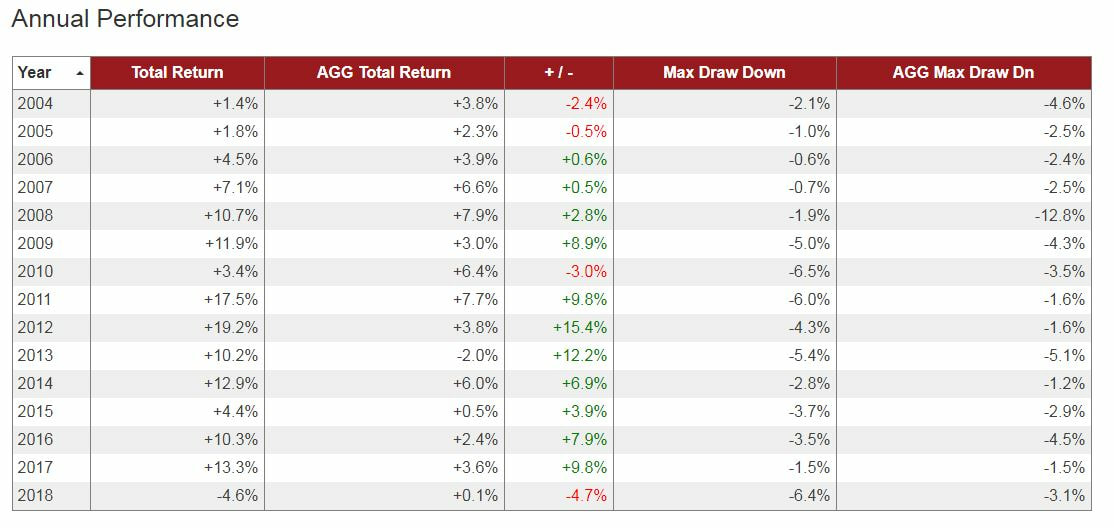
Below is the statistical analysis of the strategy based upon the period 2003-2018.
- CAGR: Compound Annual Growth Rate. Assumes 252 trading days per year.
- Sharpe Ratio: Measures reward per unit of risk. It is calculated as the annualized Avg Excess Return / Std Deviation of Excess Return. Excess Returns are calculated using the cash ETF specified (SHY default). A negative Sharpe Ratio indicates that the mean return of the strategy was less than the mean cash return.
- Max Drawdown: Greatest percentage drop from the high (based on daily closing prices). Drawdown figures should be viewed on a relative basis as rough estimates of comparative risk. In no way does drawdown represent the absolute total risk of a given ETF strategy.
Low Volatility Bond Strategy (Basic) 2003-2018
Low Volatility Bond Strategy (Enhanced) 2003-2018
Maximum Return Trading Strategy
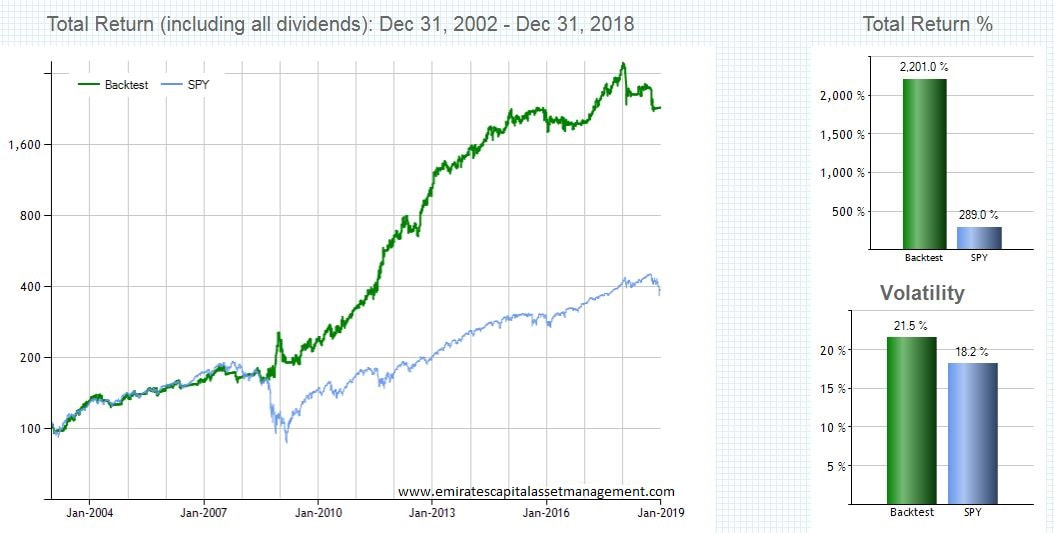
The Maximum Return Trading strategy was designed for those who desire high returns and can accept high volatility. It remains the most aggressive and top performing ECAM trading strategy. Utilizing the Maximum Return Trading Strategy would have returned (before fees/commissions and slippage) a cumulative return of +2201% for the period 2003-2018 (almost 8 times the total return of the S&P 500 Index for the period) with slightly greater overall volatility (21.5% vs. 18.2%).
Maximum Return Trading Strategy 2003-2018
Below is the statistical analysis of the strategy based upon the period 2003-2018.
- CAGR: Compound Annual Growth Rate. Assumes 252 trading days per year.
- Sharpe Ratio: Measures reward per unit of risk. It is calculated as the annualized Avg Excess Return / Std Deviation of Excess Return. Excess Returns are calculated using the cash ETF specified (SHY default). A negative Sharpe Ratio indicates that the mean return of the strategy was less than the mean cash return.
- Max Drawdown: Greatest percentage drop from the high (based on daily closing prices). Drawdown figures should be viewed on a relative basis as rough estimates of comparative risk. In no way does drawdown represent the absolute total risk of a given ETF strategy.
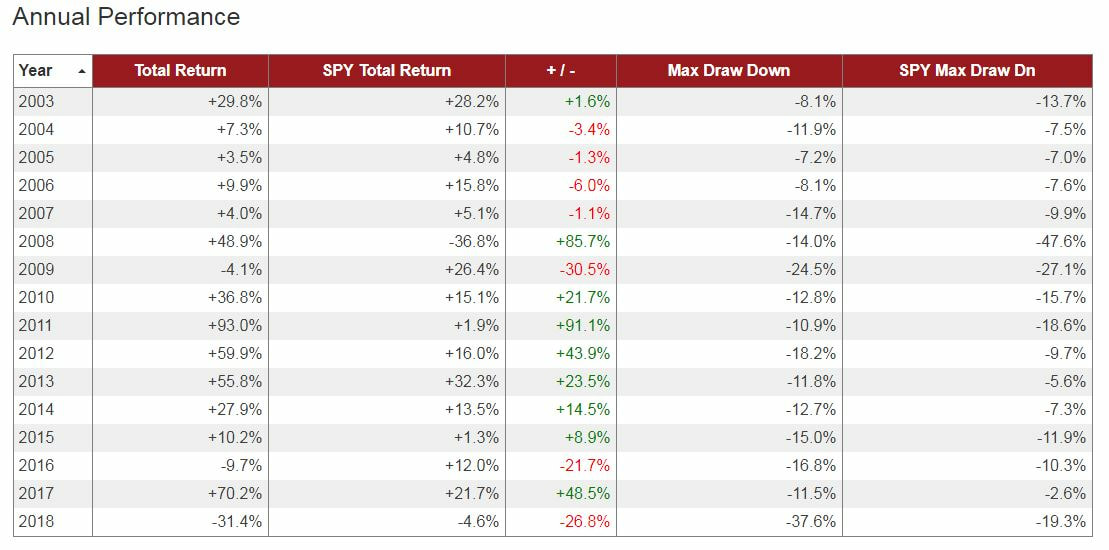
Maximum Return Trading Strategy 2003-2018
It is interesting to note the volatility over the period is somewhat higher than the S&P 500 (21.5% vs. 18.2%) but the maximum draw down experienced in the 2008 crash was approximately 1/3 that experienced by the S&P 500 (-14.0% vs. -47.6%). In the 2008 bear market decline the strategy gained +48.9% in the year while the S&P 500 benchmark lost -36.8%.
Overall this strategy produces strong returns (a Compound Annual Growth Rate of 21.7%) but with increased volatility. It is only suitable for those who desire a maximum return strategy (and are able to accept the higher volatility) or to be used as a small portion of an overall investment strategy (such as a "satellite" when employing a "core/satellite" portfolio strategy) as we do to produced the "enhanced" strategies.
All Weather Portfolio Strategy
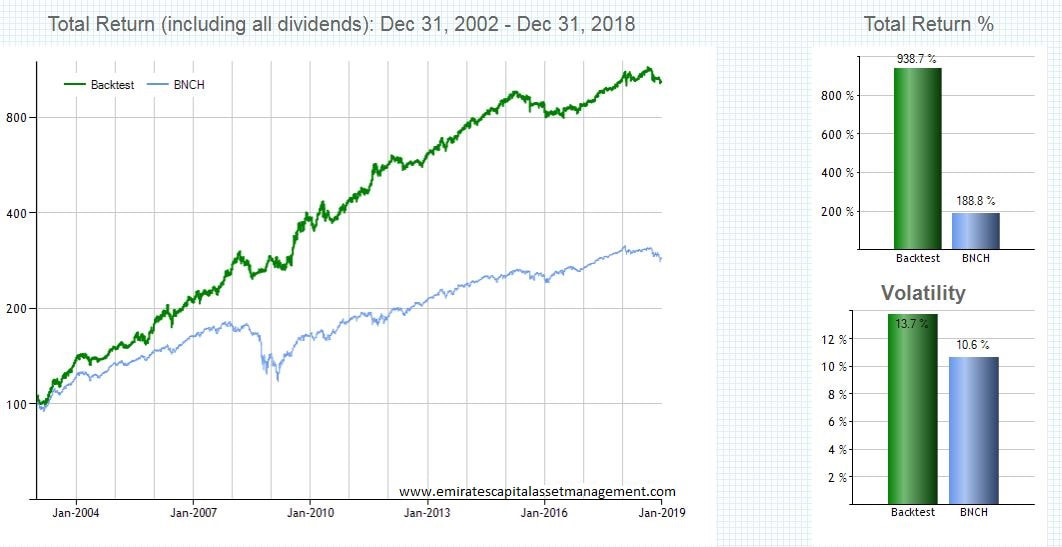
The All-Weather Trading Strategy is designed for those who desire returns greater than a typical global 60/40 mix asset ETF with similar or lower levels of volatility. The strategy has 2 forms; a Basic strategy and an Enhanced strategy. It is designed to match the volatility of a custom global benchmarket (30% VTI, 30% EFA & 40% IEF) with greatly increased returns.
The All Weather portfolio was designed to outperform the global benchmark on both return as well as volatility.
- The Basic strategy is composed of a 12 ETF universe with 60% exposure to global equities and 40% exposure to global bond ETFs.
- The Enhanced strategy is as per the Basic Strategy but it also includes exposure to medium term inverse volatility and long duration U.S. Treasury bonds.
The All Weather portfolio was designed to outperform the global benchmark on both return as well as volatility.
All Weather Portfolio Strategy (Basic) 2003-2018
All Weather Portfolio Strategy (Enhanced) 2003-2018
Below is the statistical analysis of the strategy based upon the period 2003-2018.
- CAGR: Compound Annual Growth Rate. Assumes 252 trading days per year.
- Sharpe Ratio: Measures reward per unit of risk. It is calculated as the annualized Avg Excess Return / Std Deviation of Excess Return. Excess Returns are calculated using the cash ETF specified (SHY default). A negative Sharpe Ratio indicates that the mean return of the strategy was less than the mean cash return.
- Max Drawdown: Greatest percentage drop from the high (based on daily closing prices). Drawdown figures should be viewed on a relative basis as rough estimates of comparative risk. In no way does drawdown represent the absolute total risk of a given ETF strategy.
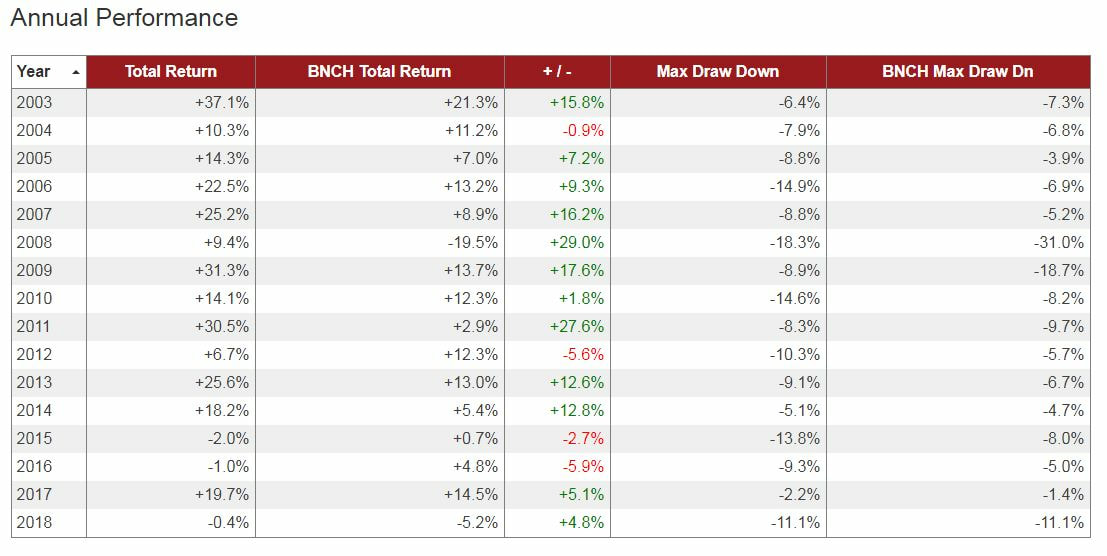
All Weather Portfolio Strategy (Basic) 2003-2018
All Weather Portfolio Strategy (Enhanced) 2003-2018


