Sentry Page Protection
Please Wait...
ECAM ETF Trading Strategies Current Positions
IMPORTANT NOTICE:
Credit Suisse AG served notice in June they were going to delist 9 ETFs/ETNs for unexplained reasons. One of the important ETN's used as part of our ECAM "enhanced" trading strategies was the VelocityShares Daily Inverse VIX Medium-Term ETN (ZIV) which was delisted in July.
At present there is no other medium-term inverse volatility ETF available on the market to replace ZIV. We suspect in the near future there will be another fund company to offer such an ETF but until then our enhanced and high yield strategies will be discontinued as a key component to their success has been removed.
We apologize for this issue but it is unfortunately beyond our control. We will continue to monitor future fund offerings and if/when another company offers such a fund we will reinstate the strategies.
OVERVIEW
All momentum-based trading strategy trades are executed on the first trading day of the new month based upon data obtained as of market close on the last trading day of the proceeding month.
Details outlining the various strategies and performance data can be found through the following link:
ETF Trading Strategy Overview (click on link to view)
As of 31 August closing prices the following ETFs/ETNs make up current trading positions in the various ETF Trading Strategies for the month of September 2020:
Multi-Asset Class ETF Trading Strategy
(Top 3 of 23 ETF Universe: 100% Equity/Bond/REIT/Precious Metals Strategy)
(Top 3 of 23 ETF Universe: 100% Equity/Bond/REIT/Precious Metals Strategy)
|
iShares MSCI USA Momentum Factor ETF (MTUM)
iShares U.S. Home Construction ETF (ITB) Invesco Solar ETF (TAN) |
33.3%
33.3% 33.3% |
All-Weather ETF Trading Strategy
(Top 2 of 12 ETF Universe: 65% Equity + 35% Bond/REIT/Precious Metals)
|
Invesco QQQ Trust (QQQ)
SPDR Bloomberg Barclays Convertible Securities ETF (CWB) |
65%
35% |
Minimum Volatility Bond ETF Trading Strategy
(Top 1 of 5 ETF Universe: 100% Bond)
(Top 1 of 5 ETF Universe: 100% Bond)
|
VanEck Vectors High-Yield Municipal Index ETF (HYD)
|
100%
|
ETF Trading Strategy Returns
For the month of August, 2020 the following gross system returns were recorded for the various ECAM ETF Trading Strategies.
|
ECAM Trading Strategy
Multi-Asset Class ETF Trading Strategy
All Weather ETF Trading Strategy Low Volatility Bond ETF Trading Strategy |
|
Monthly Commentary
The month of August continued to deliver positive equity returns for the strategies following the massive market declines in all asset classes which occurred in March (which had some of the worst drawdowns in market history on the back of the global COVID-19 pandemic).
Within the various ECAM strategies, the best performing strategies for the month once again were those with exposure to safe-haven assets such as gold and U.S. Treasuries. However, the sharp rally in equities throughout April/June is now contributing considerable influence towards risk-on asset classes for September.
Once again a reminder the computer trading algorithms we utilize employ the following look-back periods and associated weightings when selecting momentum-based ETF selections within their respective universes:
These setting were chosen following extensive computer Monte-Carlo back-testing of optimal look-back data based upon the chosen ETF universe. We have used our best efforts to avoid "curve-fitting" the data (using past history to optimize back-test returns) in order to keep the momentum factor extraction as pure as historically possible.
Based upon the optimized setting look-back periods, the various trading strategies are now under the influence of the past 5 months (positive equity returns) and past 3 months (very positive equity returns). As a reminder, momentum based trading harvests its gains in longer term trending markets (either trending UP or trending DOWN). Where they do not do well is within undecided whipsaw market conditions (which we experienced throughout 2018, early 2019 and most recently the extreme period of Feb-Mar 2020).
We continue to include the output from 2 risk-management programs. We have not incorporated them within our trading models but both have back-tested well. We present them for informational purposes to allow traders to get a "feel" for what our 2 independent risk-management "brains" think about the raw quantitative signal outputs from our ETF trading algorithms. This will allow some independent crosschecks of the efficacy of our algorithmic model outputs using the risk management programs:
Within the various ECAM strategies, the best performing strategies for the month once again were those with exposure to safe-haven assets such as gold and U.S. Treasuries. However, the sharp rally in equities throughout April/June is now contributing considerable influence towards risk-on asset classes for September.
Once again a reminder the computer trading algorithms we utilize employ the following look-back periods and associated weightings when selecting momentum-based ETF selections within their respective universes:
- 5 month look-back (105 trading days): 50% weighting
- 3 month look-back (63 trading days) : 40% weighting
- 10 trading day volatility: 10% weighting
These setting were chosen following extensive computer Monte-Carlo back-testing of optimal look-back data based upon the chosen ETF universe. We have used our best efforts to avoid "curve-fitting" the data (using past history to optimize back-test returns) in order to keep the momentum factor extraction as pure as historically possible.
Based upon the optimized setting look-back periods, the various trading strategies are now under the influence of the past 5 months (positive equity returns) and past 3 months (very positive equity returns). As a reminder, momentum based trading harvests its gains in longer term trending markets (either trending UP or trending DOWN). Where they do not do well is within undecided whipsaw market conditions (which we experienced throughout 2018, early 2019 and most recently the extreme period of Feb-Mar 2020).
We continue to include the output from 2 risk-management programs. We have not incorporated them within our trading models but both have back-tested well. We present them for informational purposes to allow traders to get a "feel" for what our 2 independent risk-management "brains" think about the raw quantitative signal outputs from our ETF trading algorithms. This will allow some independent crosschecks of the efficacy of our algorithmic model outputs using the risk management programs:
- Within the 13612W Risk Management System, ETF's with a "13612W" reading > 0 is confirmation the ETF remains within a short term uptrend. The DAA ranking show the strongest-to-weakest ranking using this metric (specific details below).
- Within the BHS Risk Management System, ETF's with a "BUY" indication have past 3 rigorous crosschecks (specific details below).
13612W Risk Management System
The 13612W momentum filter is designed with a faster response curve than typical momentum trading systems by using the average annualized returns over the past 1, 3, 6, and 12 months (with a much greater mathematical emphasis on the most recent periods). It is composed of the following calculations:
13612W = ( 12 * r1 + 4 * r3 + 2 * r6 + 1 * r12 ) / 4 where r = the simple % return over the designated period.
As an example, let us assume a hypothetical ETF has had positive returns over the past 3/6/12 months but has a negative return over the past 1 month:
The 13612W momentum calculation would be as follows:
13612W = ( 12 * r1 + 4 * r3 + 2 * r6 + 1 * r12 ) / 4 where r = the simple % return over the designated period.
As an example, let us assume a hypothetical ETF has had positive returns over the past 3/6/12 months but has a negative return over the past 1 month:
- 1 Month (4 week) return (-2.8%)
- 3 Month (past quarter) return (+2.5%)
- 6 month (past 1/2 year) return (+4.9%)
- 12 month (past 1 year) return (+12.6%)
The 13612W momentum calculation would be as follows:
13612W = (12 x -2.8) + (4 x 2.5) + (2 x 4.9) + (1 x 12.6)
4
= (-33.6) + (10.0) + (9.8) + (12.6)
4
= (-1.2)
4
= - 0.3
4
= (-33.6) + (10.0) + (9.8) + (12.6)
4
= (-1.2)
4
= - 0.3
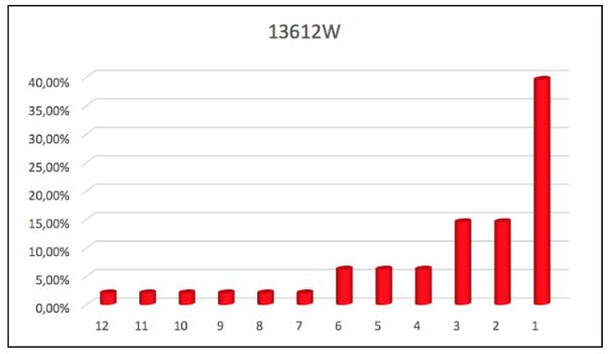
As can be seen in the above example, an ETF with strong longer term momentum (past 3/6/12 months) that experiences a negative return over the past 1 month quickly turns into a negative momentum factor (the front month contributes almost 40% to the total momentum calculation).
Below is a visual of how the momentum weighting by month is applied for the various monthly look-back periods:
Below is a visual of how the momentum weighting by month is applied for the various monthly look-back periods:
It is suggested if a given ETF has a negative 13612W momentum reading in the below table it may be appropriate to select an alternative ETF with a positive reading. The various 13612W rankings are referred to as "DAA Rank" highlighted in light BLUE to the right of the 13612W readings in the following table for those who might be interested (DAA rank from strongest to weakest ETF).
13612W Risk Management Rankings (31 August 2020)
Your browser does not support viewing this document. Click here to download the document.
Buy-Hold-Sell (BHS) Risk Management System
(Dual momentum ranking with Linear Regression + Heikin-Ashi candle input)
(Dual momentum ranking with Linear Regression + Heikin-Ashi candle input)
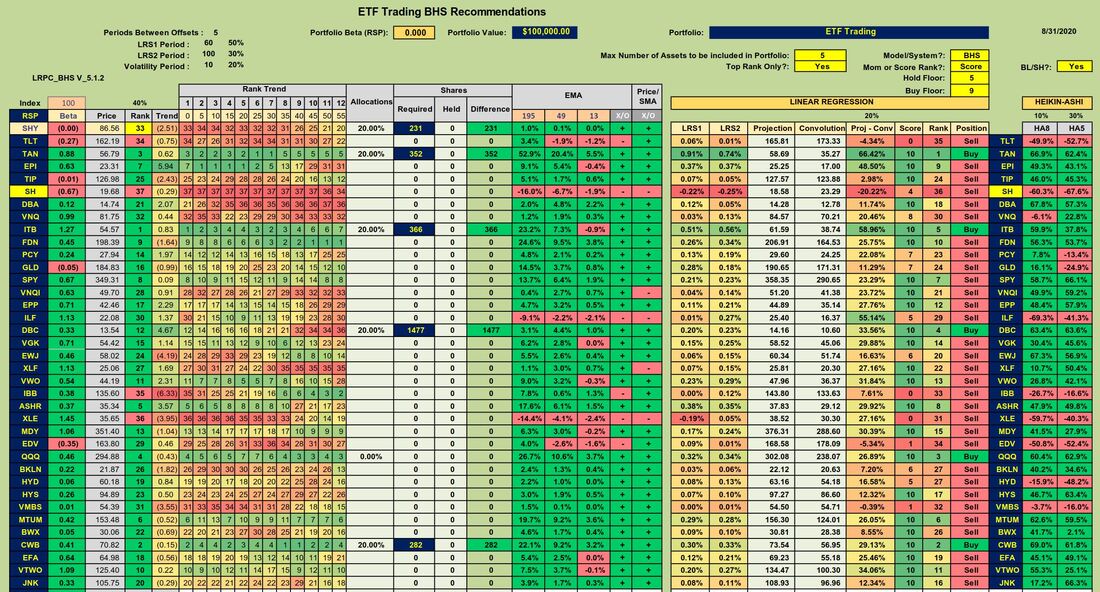
The following program combines a dual momentum calculation (40% of input) with a linear regression calculation (20% of input) as well as 5 + 8 day Heikin-Ashi candle analysis (40% of input).
Ideally chosen ETF's would display all of the following bullish attributes:
The below table can be used to compare the ETF outputs from our model with their relative momentum characteristics using these metrics. All ETFs that pass the 3 bullish attribute tests are shown with a "Buy" signal in green in the 4th column from the right.
Ideally chosen ETF's would display all of the following bullish attributes:
- a strong Momentum rank trend ("Rank" in column 4 just after price on the left side of the algorithm)
- a strong Linear Regression rank trend ("Rank" on the right side of the algorithm)
- a green 5 and 8 day Heikin-Ashi candle reading (HA8 + HA5 on far right side of the algorithm)
The below table can be used to compare the ETF outputs from our model with their relative momentum characteristics using these metrics. All ETFs that pass the 3 bullish attribute tests are shown with a "Buy" signal in green in the 4th column from the right.
BHS Risk Management Rankings (31 August 2020)
Best/Worst Year
(Maximum Draw-down & Subsequent Year-end Final Return)
(Maximum Draw-down & Subsequent Year-end Final Return)
We highlight below the worst/best historical return metrics for each of the trading strategies over the past 17 years to assist with analyzing potential risk vs. reward dynamics (historical best case/worst case for the various strategies):
|
Best Year
Max Drawdown Final Return Worst Year Max Drawdown Final Return Worst Month (Date) |
Multi-Asset
Basic 2009
-12.7% +45.4% 2018 -21.3% -14.5% -11.8% (10/18) |
Multi-Asset Enhanced
2013
-10.3% +47.7% 2018 -26.6% -21.2% -14.2% (10/18) |
Maximum Yield
2011
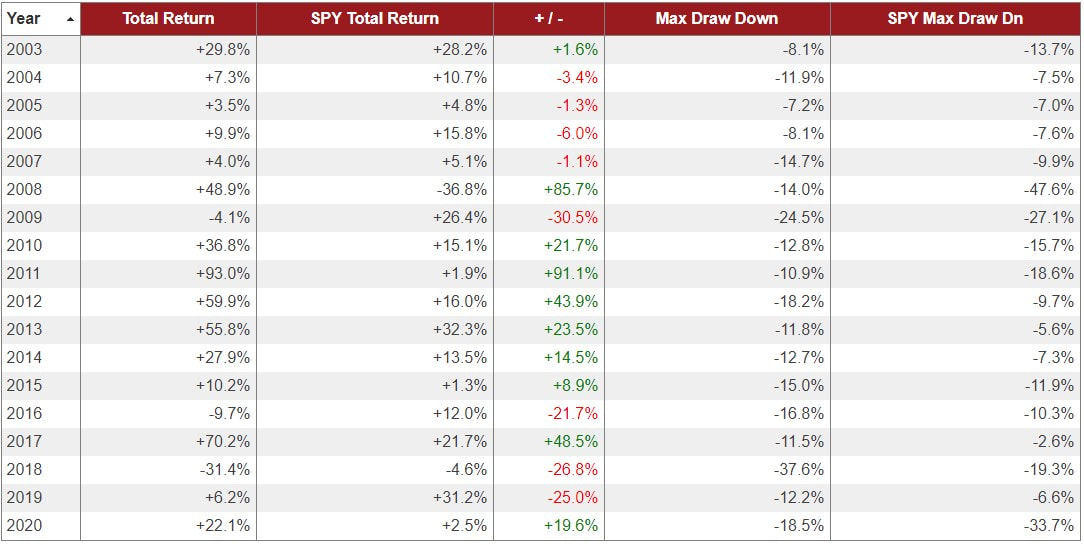
-10.9% +93.0% 2018 -37.6% -31.4% -21.7% (02/18) |
All Weather Basic
2009
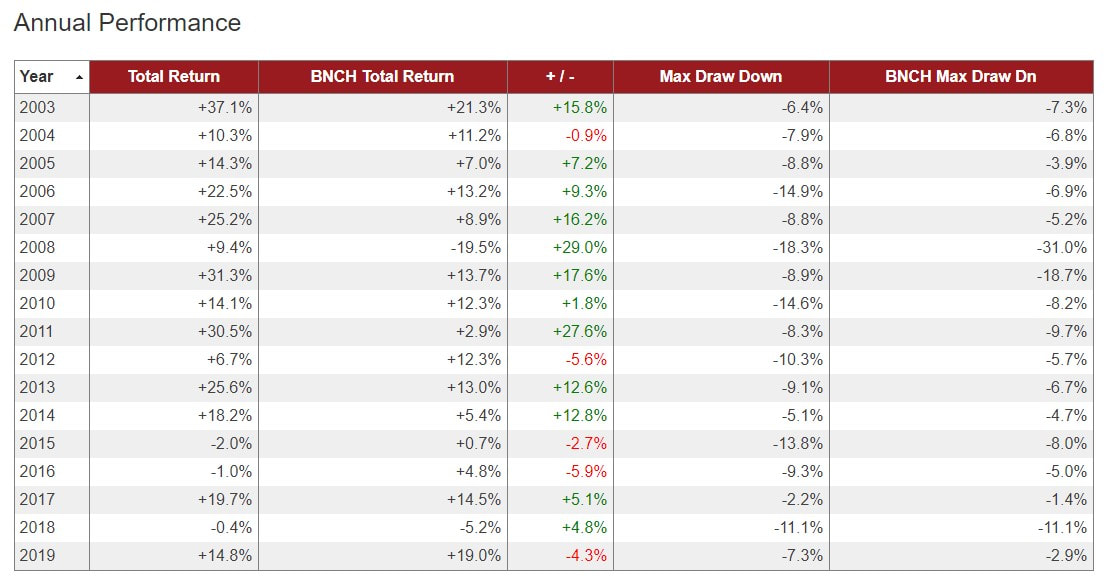
-8.9% +31.3% 2015 -13.8% -2.0% -8.6% (06/08) |
All Weather Enhanced
2011
-6.9% +48.5% 2018 -15.8% -10.3% -10.5% (01/09) |
Low Vol Bond Basic
2012
-4.7% +14.9% 2018 -3.6% -1.5% -4.1% (11/10) |
Low Vol Bond Enhanced
2012
-4.3% +19.2% 2018 -6.4% -4.6% -3.4% (11/10) |
|
|
|
ECAM ETF Trading Strategies Description and Performance
Strategy Performance Metrics:
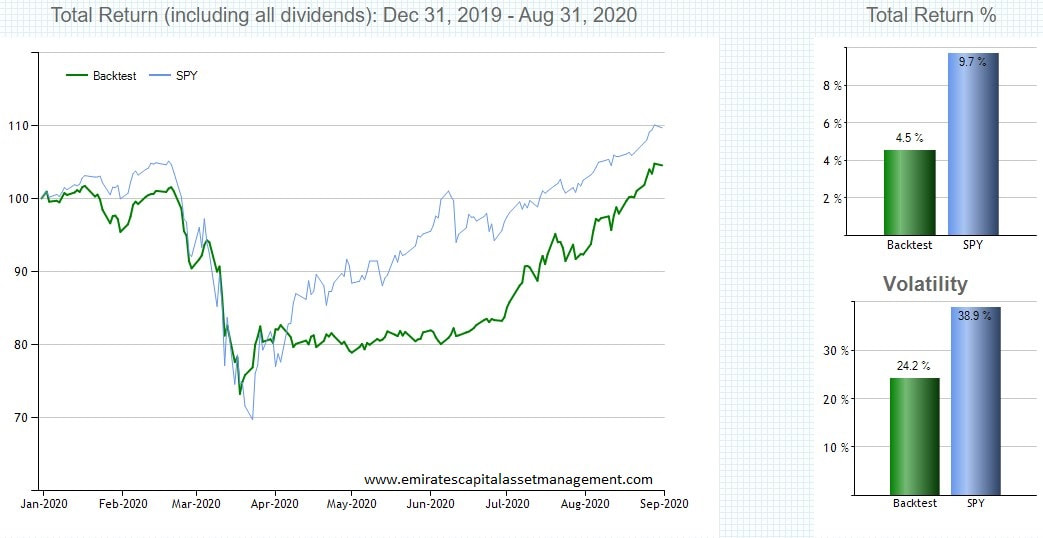
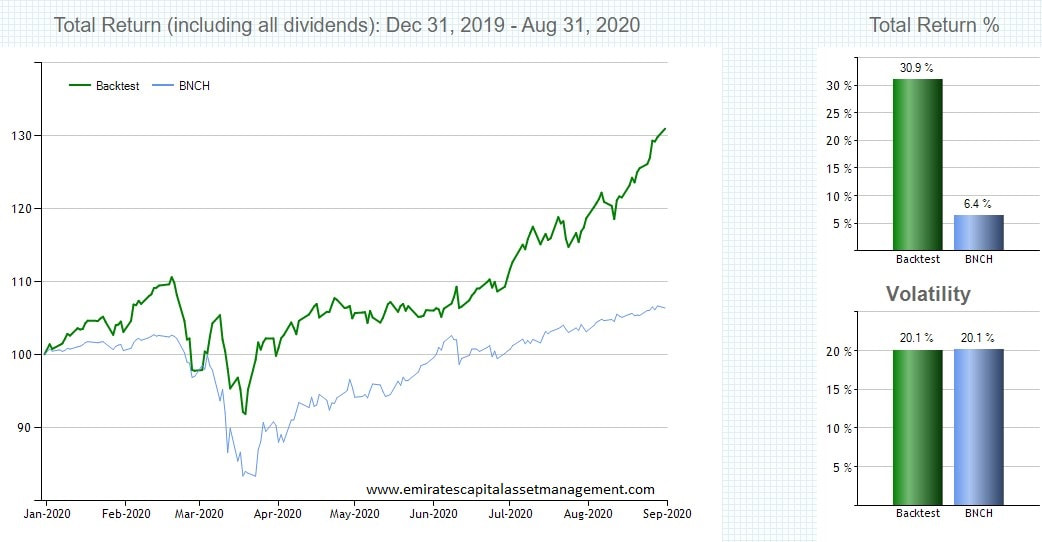
- 2019 Year-To-Date performance
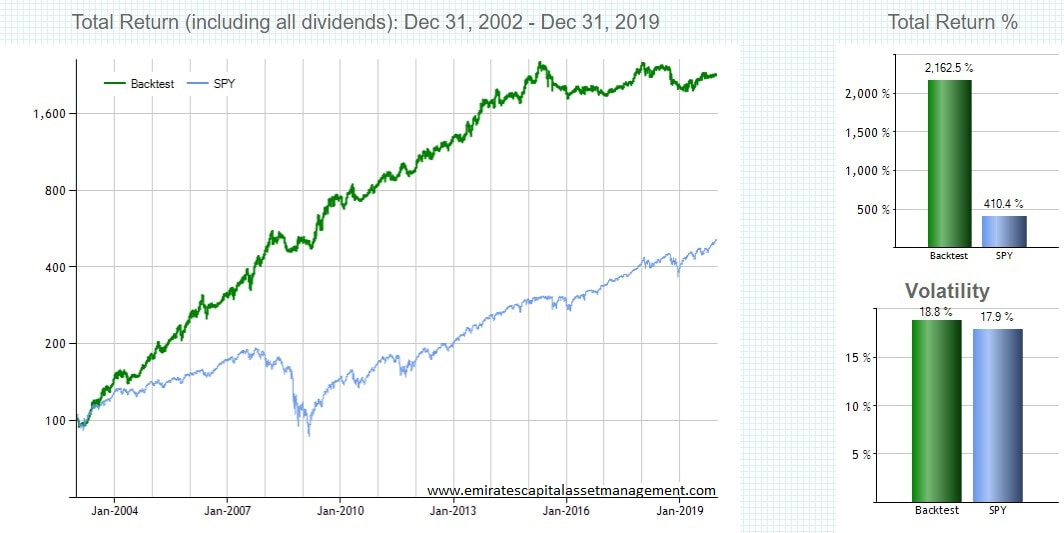
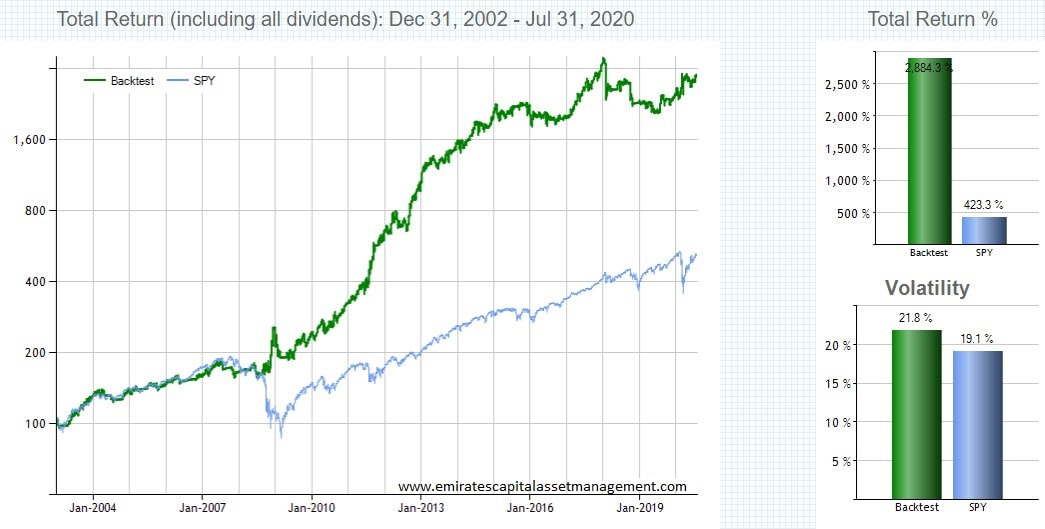
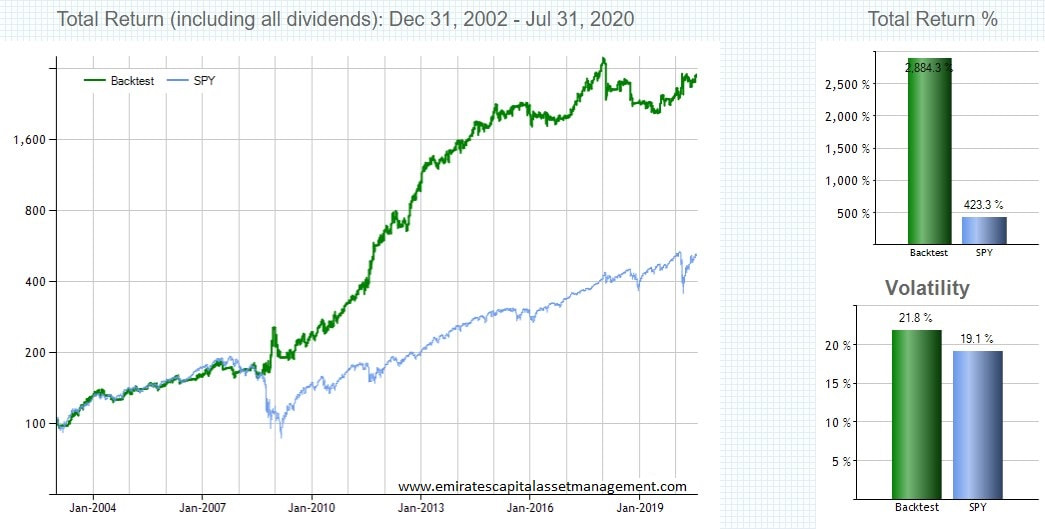
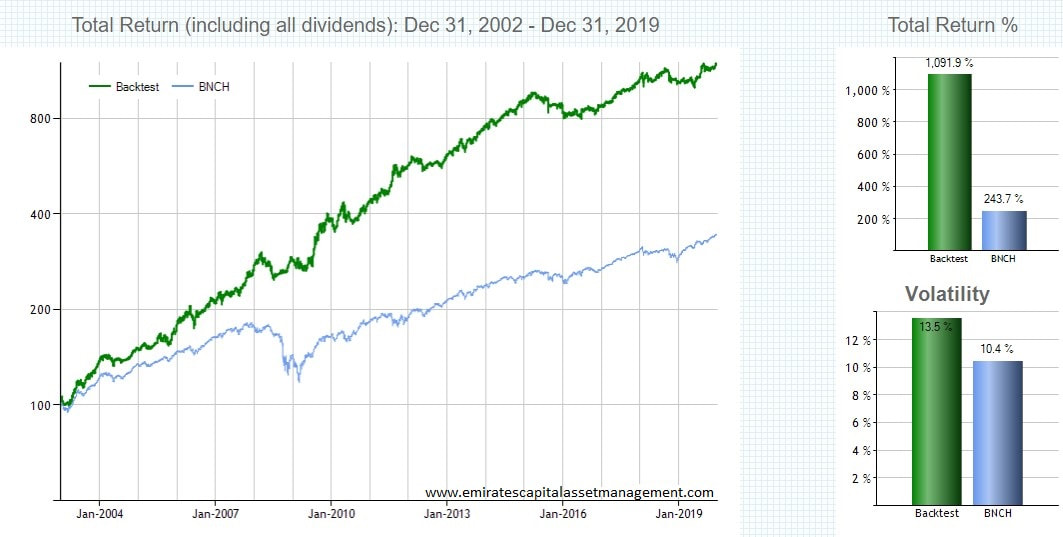
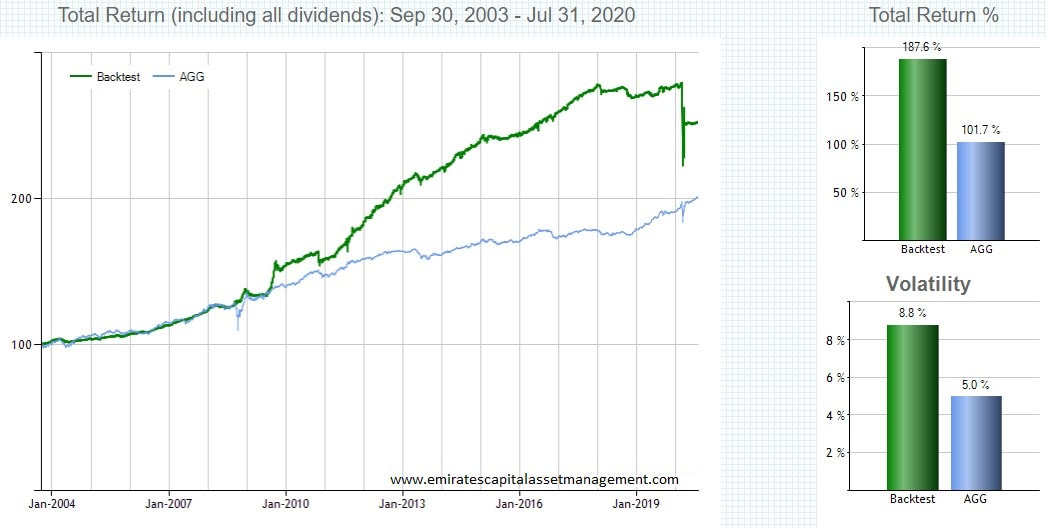
- 2003-2018 Performance graphic
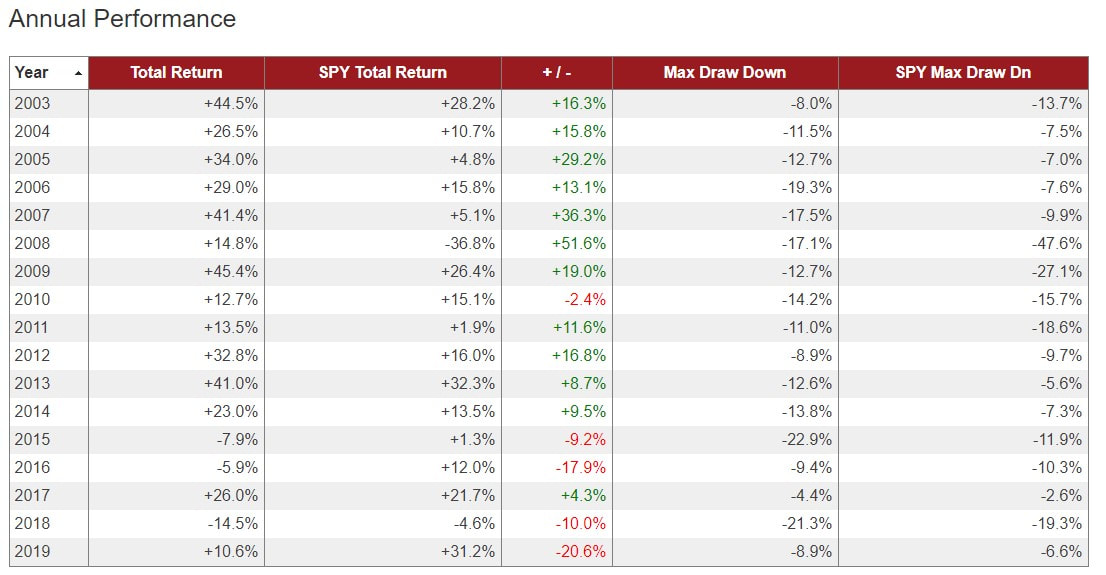
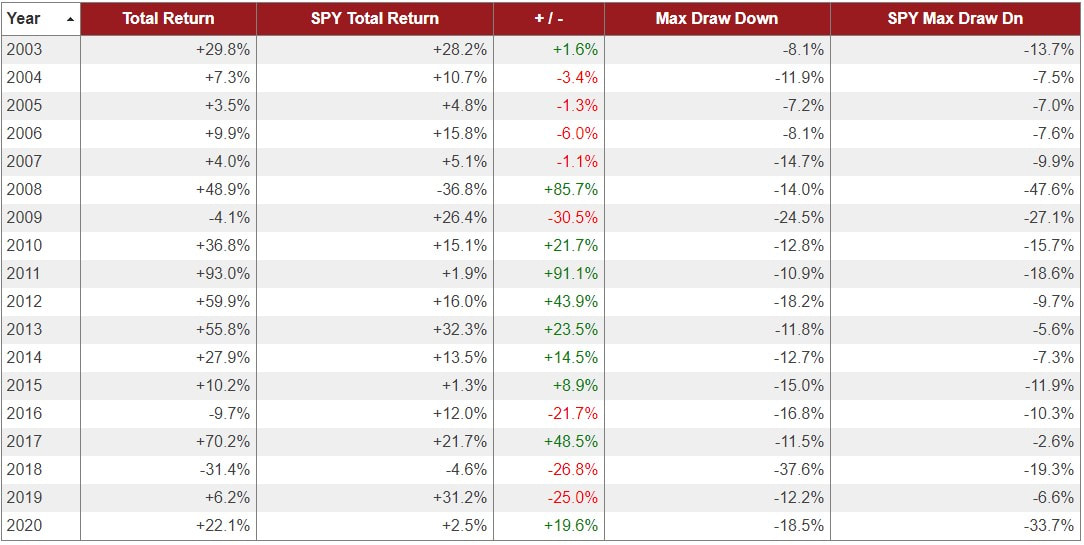
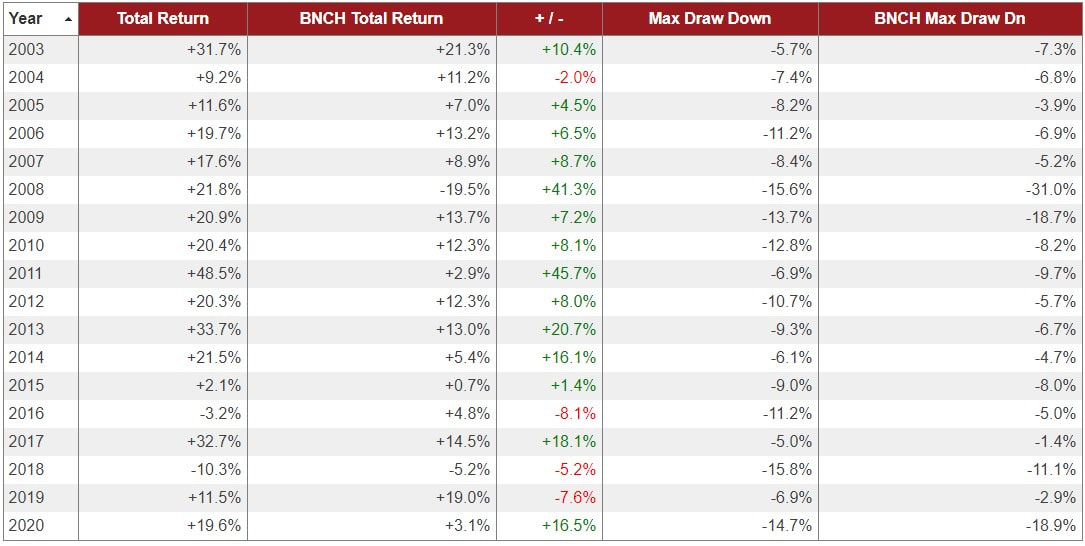
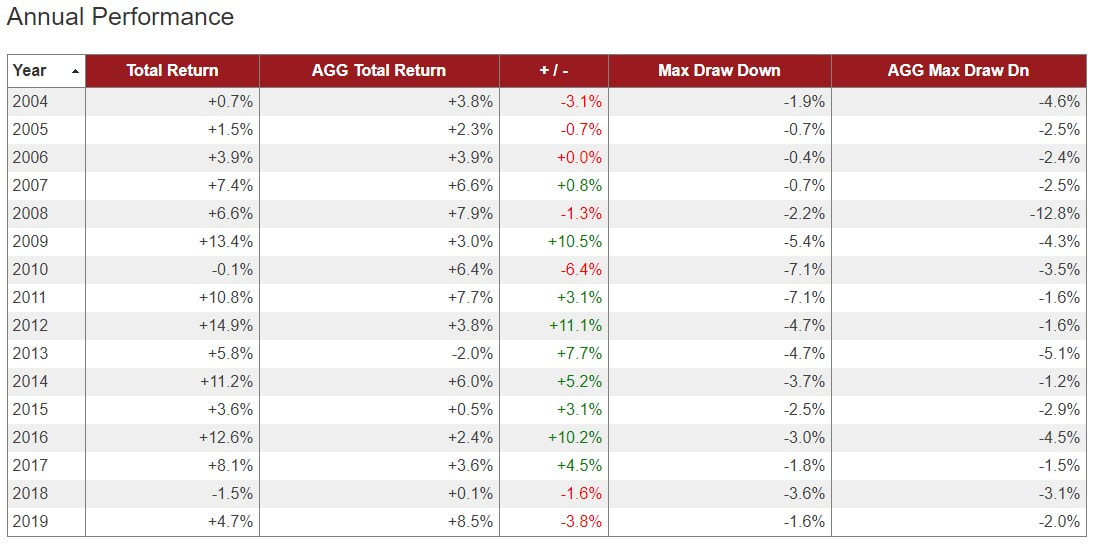
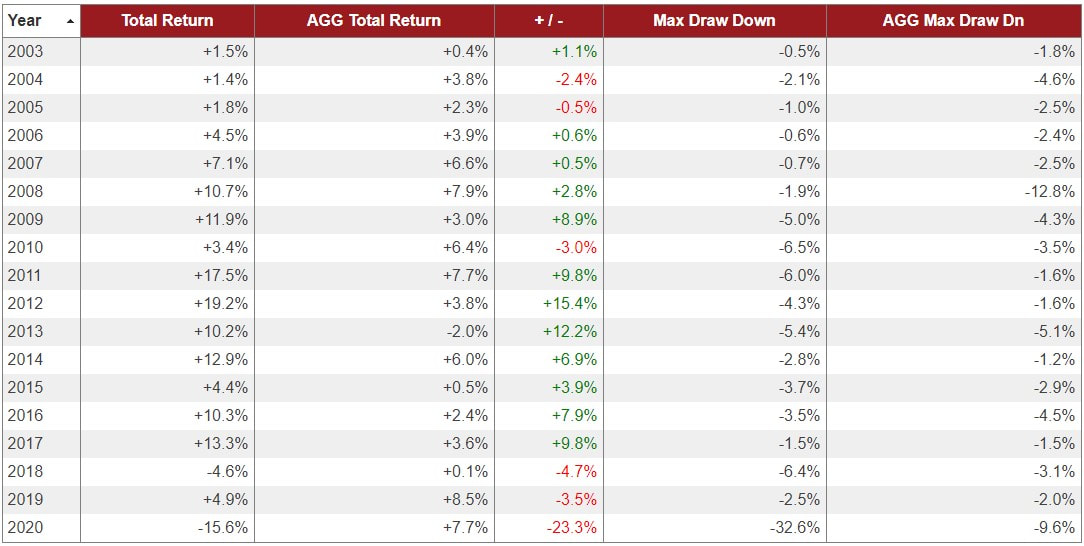
- 2003-2018 Performance by year
- 2003-2018 Performance statistics
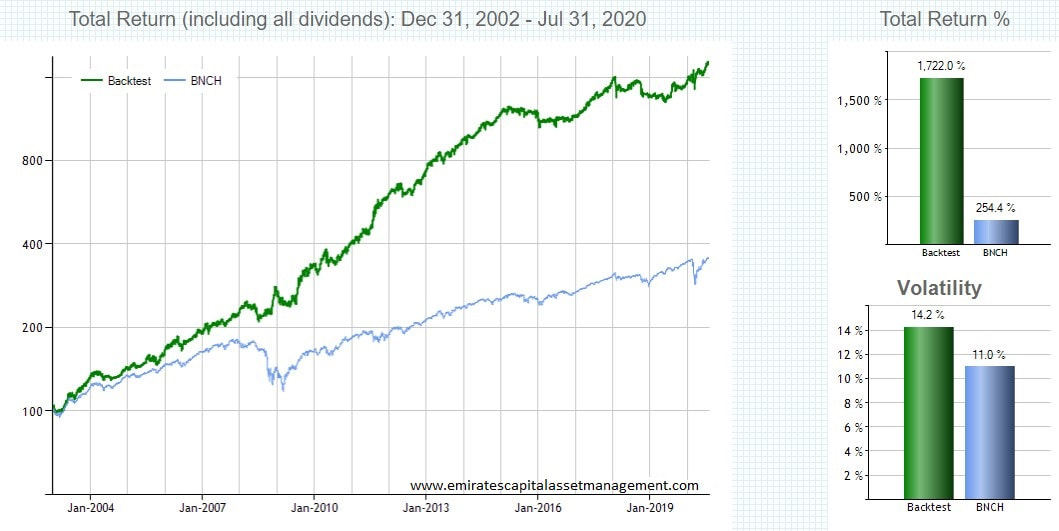
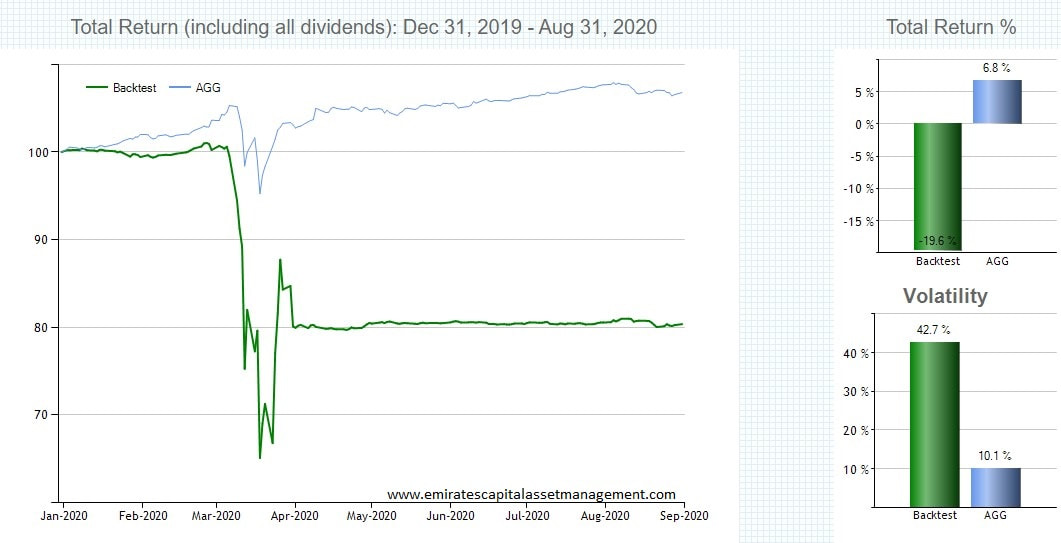
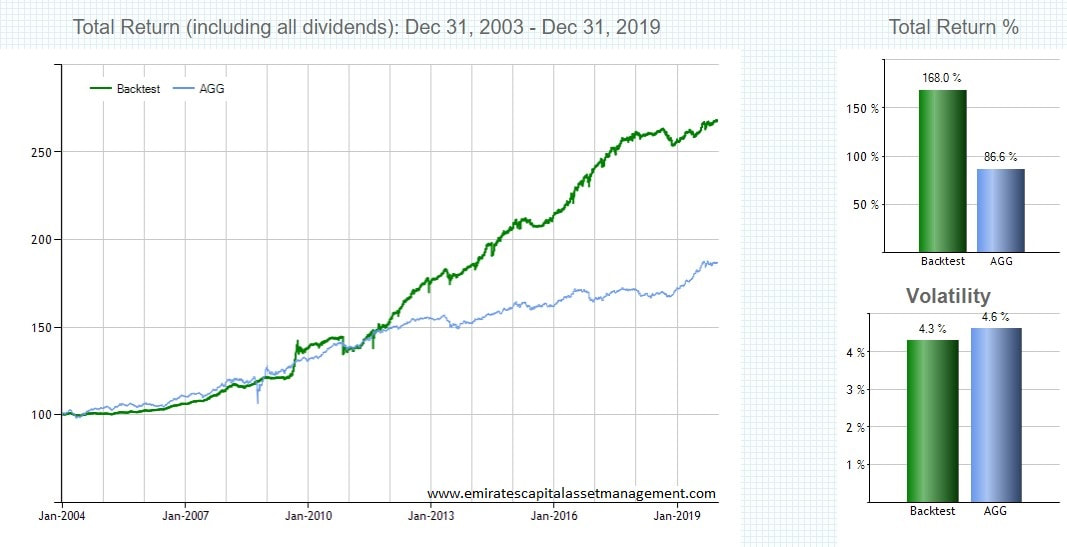
(Green line is the chosen ECAM strategy; Blue line is the chosen benchmark).
* all performance based upon gross system returns as of the closing price on the last trading day of the month. All returns including dividends but not inclusive of trading commissions, slippage and tax considerations. Individual returns will vary based upon these factors.
Multi-Asset ETF Trading Strategy
Traded once/month selecting the top performing 3 (Basic) or 4 (Enhanced) ETF's from a universe of 27 ETF's covering:
-Returns and Volatility bench-marked with reference to SPY (the S&P 500 ETF).
- U.S. Equity
- International Equity
- Emerging Markets Equity
- Quasi-Equity: (REITs, Preferreds)
- U.S. Treasury Bonds/TIPS
- Corporate/Credit Bonds
- Int'l Bonds / Currencies
- Commodities/Precious Metals
- Volatility Derivatives (enhanced strategy only)
-Returns and Volatility bench-marked with reference to SPY (the S&P 500 ETF).
Multi Asset (Basic) Strategy
Year-to-Date (to 31 August)
Year-to-Date (to 31 August)
Multi-Asset (Basic) Strategy
2003-2019
2003-2019
Multi Asset (Enhanced) Strategy
(Discontinued 31 July 2020)
Maximum Yield ETF Trading Strategy
Traded once/month selecting the top performing 1 ETF from a universe of 4 ETF's covering:
-Returns and Volatility bench-marked with reference to SPY (the SPDR S&P 500 ETF).
- U.S. Mid-Cap Equity
- U.S. Extended Duration Treasury Bonds
- Volatility Derivatives
-Returns and Volatility bench-marked with reference to SPY (the SPDR S&P 500 ETF).
Maximum Yield Strategy
(Discontinued 31 July 2020)
(Discontinued 31 July 2020)
All Weather ETF Trading Strategy
Traded once/month selecting the top performing 2 (Basic) or 3 (Enhanced) ETF's from a universe of 16 ETF's covering:
-Returns and Volatility bench-marked with reference to BNCH (an all-world 60% equity/40% bond composite benchmark composed of VTI 30%, EFA 30%, IEF 40%).
- U.S. Equity
- Quasi-Equity: (REITs, Preferreds)
- U.S. Treasury Bonds/TIPS
- Commodities/Precious Metals
- Volatility Derivatives (Enhanced strategy only)
-Returns and Volatility bench-marked with reference to BNCH (an all-world 60% equity/40% bond composite benchmark composed of VTI 30%, EFA 30%, IEF 40%).
All Weather (Basic)
Year-to-Date (to 31 August)
Year-to-Date (to 31 August)
All Weather (Basic)
2003-2019
2003-2019
All Weather (Enhanced)
(Discontinued 31 July 2020)
(Discontinued 31 July 2020)
Low Volatility Bond ETF Trading Strategy
Traded once/month selecting the top performing 1 (Basic) or 2 (Enhanced) ETFs from a universe of 9 ETF's covering:
-Returns and Volatility bench-marked with reference to AGG (the iShares Core US Aggregate Bond ETF).
- Short duration High Yield Municipal Bonds
- Short duration High Yield Bonds
- Long duration Mortgaged Back Securities Bonds
- Floating-rate, High Yield Senior corporate debt
- Short duration U.S. Treasuries
- Mid-Cap equity/Long Duration bonds/Inverse Medium Volatility (enhanced strategy only)
-Returns and Volatility bench-marked with reference to AGG (the iShares Core US Aggregate Bond ETF).
Low Volatility Bond (Basic) Strategy
Year-to-Date (to 31 August)
Year-to-Date (to 31 August)
Low Volatility Bond (Basic) Strategy 2004-2019
Low Volatility Bond (Enhanced) Strategy
(Discontinued 31 July 2020)

